Getting Geographical Coordinates in R Math, CS, Data
Here is a simple function for getting the longitudes and latitudes for a vector of places.
library(XML)

longlat <- function(addrs) {
    longlat1 <- function(addr) {
        # Attempts to retrieve longitude and latitude from place name
        url = paste0("http://maps.google.com/maps/api/geocode/xml?address=",
            addr, "&sensor=false")
        doc <- NA
        r <- c(NA, NA)
        try(doc <- xmlTreeParse(url), silent = T)
        if (!is.na(doc[1])) {
            root = xmlRoot(doc)
            long = xmlValue(root[["result"]][["geometry"]][["location"]][["lng"]])
            lat = xmlValue(root[["result"]][["geometry"]][["location"]][["lat"]])
            r <- c(long, lat)
        } else {
            print(paste("Error: Could not find", addr))
        }
        return(as.numeric(r))
    }
    l <- longlat1(addrs[1])
    if (length(addrs) > 1) {
        for (i in 2:length(addrs)) {
            l <- rbind(l, longlat1(addrs[i]))
        }
    }
    return(l)
}
The function is demonstrated below for a handful of cities. Notice that I created a space function to make room on the plot for the text that will be placed on it. The locations can be plotted on a blank space, but I have placed this demo on a ready-made US map provided by the maps package.
space <- function(v, percent = 10) {
    # Provide an extra margin for adding text to a plot
    r <- percent/100 * (max(v) - min(v))
    return(c(min(v) - r, max(v) + r))
}

cities <- c("Seattle", "San Francisco", "Boulder", "Austin", "Boston")
ll <- longlat(cities)

library(maps)

map("state", interior = FALSE, xlim = space(ll[, 1], percent = 20))
map("state", boundary = FALSE, col = "gray", add = TRUE)
title("Map of my Favorite US Cities")

points(ll, col = 2, pch = 20)
lab <- ll
lab[, 2] <- lab[, 2] + 1.3
text(lab, cities, col = 4, cex = 1.2)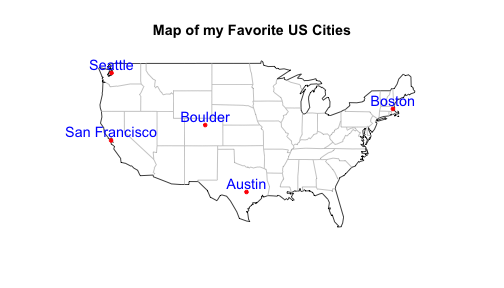
blog comments powered by Disqus